1 Investor Presentation Filed Pursuant to Rule 433 Registration No. 333 - 213572 November 18, 2016 © 2016 Polar Power, Inc. All Rights Reserved. All photos in this document are from actual sites / applications with Polar Power, Inc . products installed . Polar does not provide the platforms, radios, antennas or towers . PROVIDING LOW COST RELIABLE POWER FOR TELECOMMUNICATIONS
2 This presentation highlights basic information about us and the proposed public offering. Because this presentation is a summ ary , it does not contain all of the information you should consider before investing in our securities. We have filed a registration statement (including a preliminary prospectus) with the SEC for the offering. The registration sta tement has not yet become effective. Before you invest, you should carefully read the preliminary prospectus, the registration statement, and an y o ther documents incorporated by reference therein for more complete information about us and this proposed public offering. This free writing prospectus should be read together with the preliminary prospectus dated November 18, 2016 included in that registration s tatement , which can be accessed through the following link : https:// www.sec.gov/Archives/edgar/data/1622345/000161577416008460/s104682_s1a.htm You may obtain these documents free of charge by searching the SEC online database (EDGAR) on the SEC web site at http://www. sec .gov. Alternatively, a copy of the preliminary prospectus relating to the offering may be obtained, when available, by contacting R oth Capital Partners, 888 San Clemente Drive, Suite 400, Newport Beach, CA 92660, (800) 678 - 9147 or Joseph Gunnar & Co., LLC Prospectus Depa rtment, Thirty Broad Street, 11th Floor, New York, NY 10004, telephone: 212 - 440 - 9600, e - mail: prospectus@jgunnar.com. FREE WRITING PROSPECTUS STATEMENT 2
3 The following discussion, in addition to the other information contained in this presentation, should be considered carefully in evaluating our prospects . This presentation (including without limitation the following factors that may affect operating results) contains forward - looking statements regarding us and our business, financial condition, results of operations and prospects . Words such as "expects," "anticipates," "intends," "plans," "believes," "seeks," "estimates" and similar expressions or variations of such words are intended to identify forward - looking statements, but are not the exclusive means of identifying forward - looking statements in this presentation . Additionally, statements concerning future matters such as revenue projections, projected profitability, growth strategies, and other statements regarding matters that are not historical are forward - looking statements . Forward - looking statements in this presentation reflect the good faith judgment of our management and the statements are based on facts and factors as we currently know them . Forward - looking statements are subject to risks and uncertainties and actual results and outcomes may differ materially from the results and outcomes discussed in the forward - looking statements . Factors that could cause or contribute to such differences in results and outcomes include, but are not limited to, those discussed in this presentation . Readers are urged not to place undue reliance on these forward - looking statements which speak only as of the date of this presentation . We undertake no obligation to revise or update any forward - looking statements in order to reflect any event or circumstance that may arise after the date of this presentation . This presentation shall not constitute an offer to sell or the solicitation of an offer to sell or the solicitation of an offer to buy any securities of the Company nor shall there be any sale of securities in any jurisdiction in which such offer, solicitation or sale would be unlawful prior to registration or qualification under the securities laws of any such jurisdiction . 3 SAFE HARBOR
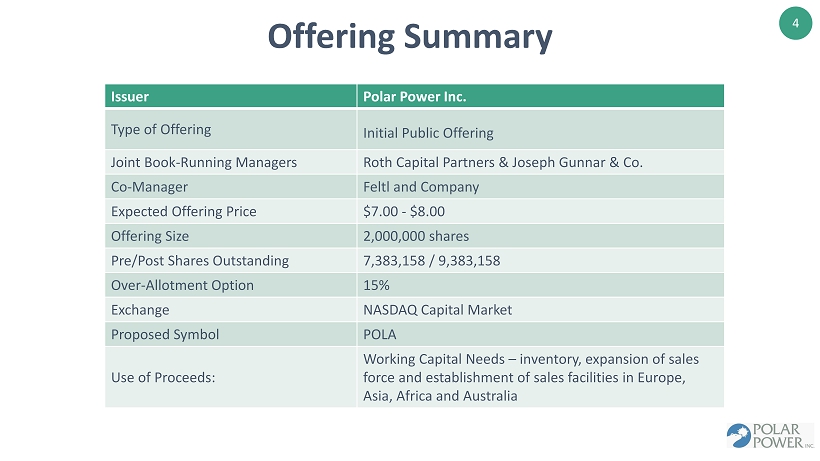
4 Offering Summary Issuer Polar Power Inc. Type of Offering Initial Public Offering Joint Book - Running Managers Roth Capital Partners & Joseph Gunnar & Co. Co - Manager Feltl and Company Expected Offering Price $7.00 - $8.00 Offering Size 2,000,000 shares Pre/Post Shares Outstanding 7,383,158 / 9,383,158 Over - Allotment Option 15% Exchange NASDAQ Capital Market Proposed Symbol POLA Use of Proceeds: Working Capital Needs – inventory, expansion of sales force and establishment of sales facilities in Europe, Asia, Africa and Australia
5 Key Management ARTHUR D. SAMS LUIS ZAVALA RAJ MASINA B. SAMRA CEO and President Acting CFO VP Operations Corporate VP • Since 1991, has served as our President, Chief Executive Officer and Chairman of our board of directors. • In his career, has worked as a c onsultant to numerous Fortune 500 companies, the U.S. Department of Defense and U.S. Department of Energy • 45 years experience in engineering, machinery, sales, marketing, project manager & CTO and President roles • 2016 – Present Acting Chief Financial Officer of Polar Power • 2009 – Present - Vice President of Finance – Polar Power • 2006 – 2009 - President of Sky Limited Enterprises (General Contractor) • 2001 – 2006 - Director of Finance for Legacy Long Distance International • 20 years experience in managing accounting and finance departments • 2009 – Present – Vice President of Operations of Polar Power • 2008 – 2009 – Supply chain consultant to International Game Technology • 2006 – 2008 – Assistant manager for Applied Photonics Worldwide • 15 years experience in engineering, business analytics, supply chain management and strategic planning • 2005 – 2015 – CEO of Balqon Corp, a public company • 2000 – 2005 – Founder and CEO of EVI Corp • 1990 – 2000 – Corporate VP, Taylor Dunn Manufacturing • 1985 – 1990 – Director of Operations, Flextronics • 30 years experience in global operations, M & A, investment banking, corporate governance, finance and strategic consulting
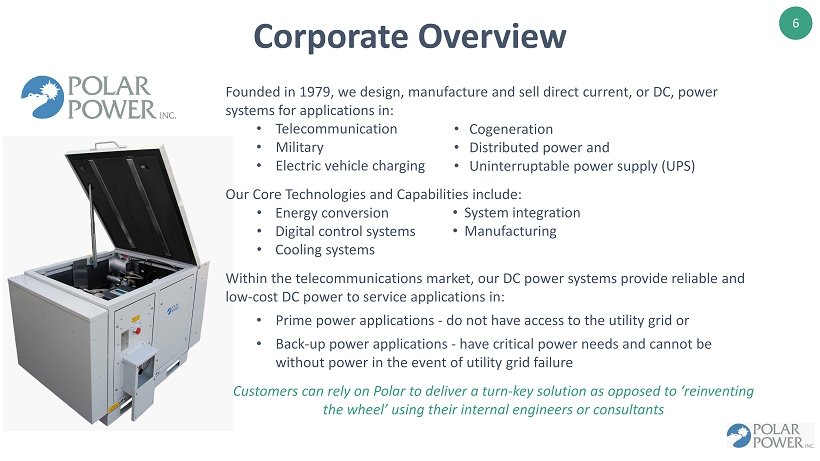
6 Corporate Overview Founded in 1979, we design, manufacture and sell direct current, or DC, power systems for applications in: • Telecommunication • Military • Electric vehicle charging Our Core Technologies and Capabilities include : • Energy conversion • Digital control systems • Cooling systems Within the telecommunications market, our DC power systems provide reliable and low - cost DC power to service applications in: • Prime power applications - do not have access to the utility grid or • Back - up power applications - have critical power needs and cannot be without power in the event of utility grid failure Customers can rely on Polar to deliver a turn - key solution as opposed to ‘reinventing the wheel’ using their internal engineers or consultants • Cogeneration • Distributed power and • Uninterruptable power supply (UPS) • System integration • Manufacturing
7 Investment Highlights Broad Market Opportunities In Telecommunications, Distributed Power, Cogeneration, Military, Electric Vehicle Charging & Uninterruptible Power Supply (UPS) • Multi - billion dollar opportunity with multiple applications within multiple markets • Top - tier customer base including Verizon, AT&T and Telstra • Direct sales / relationships with customers Strong Technology History & Brand Recognition With Proprietary DC Power System Technologies • Leadership in energy conversion, power generation, energy storage and digital controls • Our DC power systems are smaller, lighter, and more efficient than AC power systems • Integrated controls with remote monitoring and control • Manufacturing expertise enables us to provide a turnkey, fully integrated system Track Record Of Growth and Profitability • Funded a decade of growth with free cash flow generated by operations • Offering proceeds will support product development and greater penetration of existing customers and broader outreach to new customers and end markets
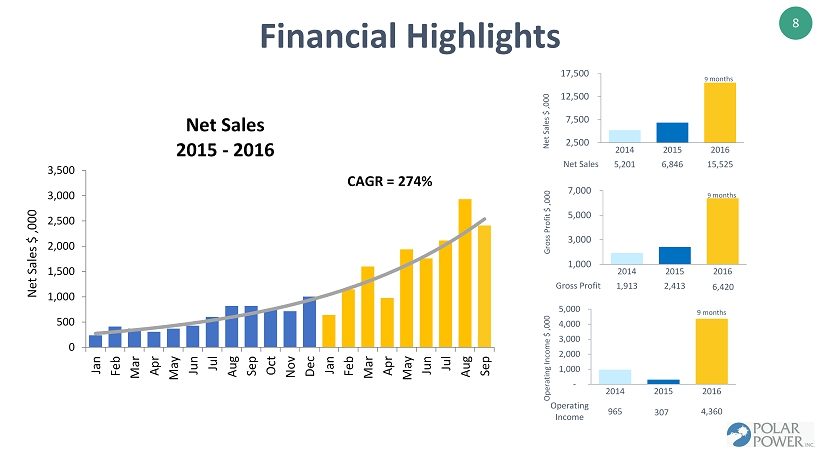
8 0 500 1,000 1,500 2,000 2,500 3,000 3,500 Jan Feb Mar Apr May Jun Jul Aug Sep Oct Nov Dec Jan Feb Mar Apr May Jun Jul Aug Sep Net Sales 2015 - 2016 Net Sales $ ,000 CAGR = 274% 2,500 7,500 12,500 17,500 2014 2015 2016 Net Sales 5,201 6,846 15,525 9 months 1,000 3,000 5,000 7,000 2014 2015 2016 Gross Profit 1,913 2,413 6,380 - 1,000 2,000 3,000 4,000 5,000 2014 2015 2016 Operating Income 965 307 4,360 9 months 9 months Net Sales $ ,000 Gross Profit $ ,000 Operating Income $ ,000 Financial Highlights 6,420 307
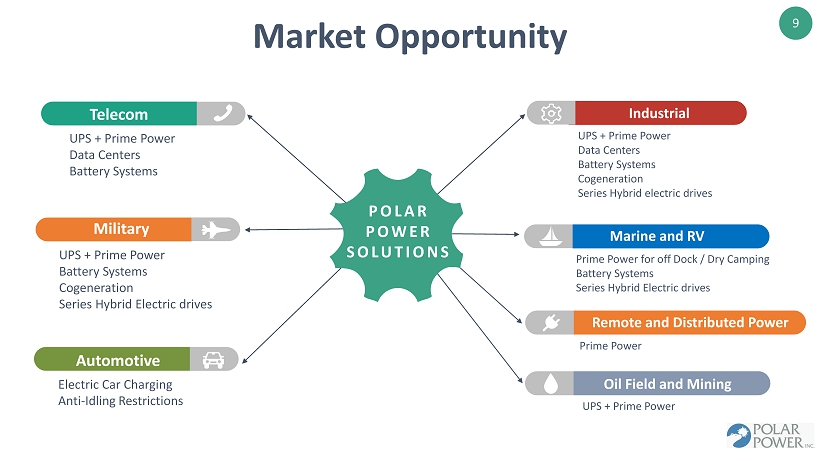
9 Market Opportunity . Telecom Military Automotive Industrial Marine and RV Remote and Distributed Power POLAR POWER SOLUTIONS Oil Field and Mining UPS + Prime Power Data Centers Battery Systems UPS + Prime Power Battery Systems Cogeneration Series Hybrid Electric drives UPS + Prime Power Data Centers Battery Systems Cogeneration Series Hybrid electric drives Electric Car Charging Anti - Idling Restrictions Prime Power for off Dock / Dry Camping Battery Systems Series Hybrid Electric drives Prime Power UPS + Prime Power
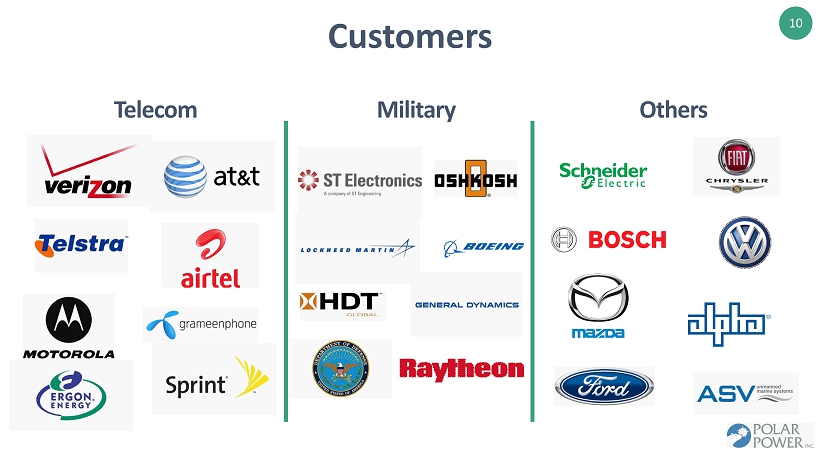
10 Customers Telecom Military Others
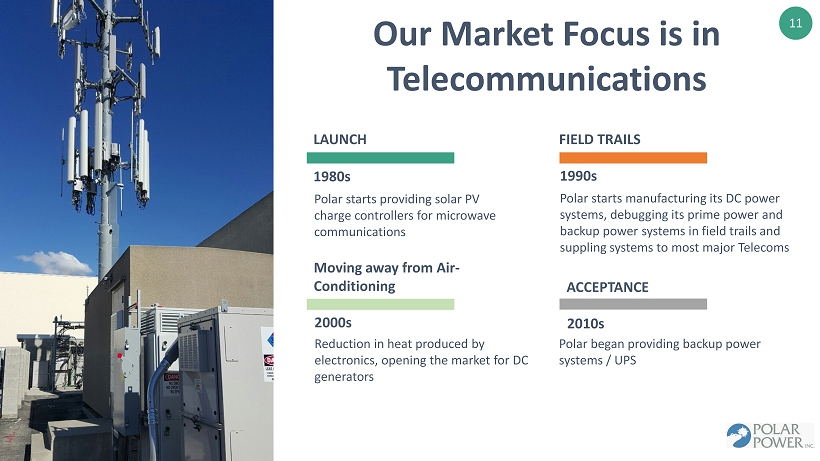
11 Our Market Focus is in Telecommunications 1980s LAUNCH 1990s FIELD TRAILS 2010s ACCEPTANCE Polar began providing backup power systems / UPS Polar starts providing solar PV charge controllers for microwave communications Polar starts manufacturing its DC power systems, debugging its prime power and backup power systems in field trails and suppling systems to most major Telecoms 2000s Moving away from Air - Conditioning Reduction in heat produced by electronics, opening the market for DC generators
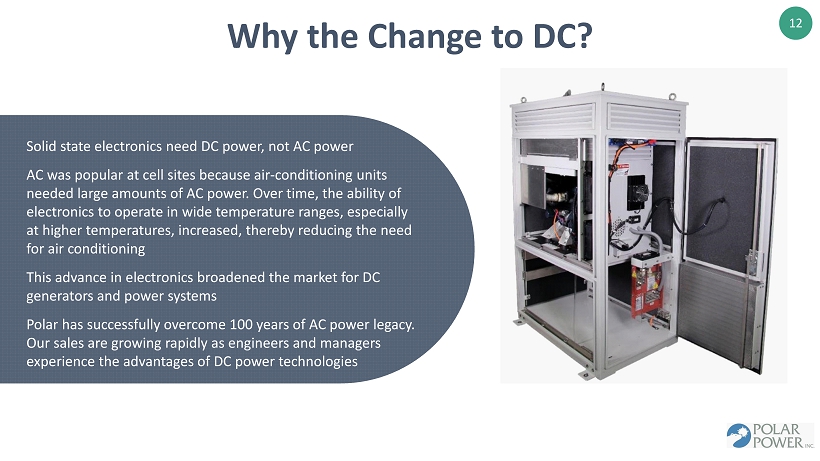
12 Why the Change to DC? Solid state electronics need DC power, not AC power AC was popular at cell sites because air - conditioning units needed large amounts of AC power. Over time, the ability of electronics to operate in wide temperature ranges, especially at higher temperatures, increased, thereby reducing the need for air conditioning This advance in electronics broadened the market for DC generators and power systems Polar has successfully overcome 100 years of AC power legacy. Our sales are growing rapidly as engineers and managers experience the advantages of DC power technologies

13 Why Telecoms & Commercial Companies Need Backup Power or Uninterruptible Power Supply (UPS) • Mission - critical businesses can’t afford to be without power ‒ Data centers ‒ Financial institutions ‒ Hospitals • Results are lost revenue, customers and human safety • Telecoms – FCC requirement for all cell towers to have some form of backup power following hurricane Sandy • More businesses are questioning the reliability of today’s public power grid • Natural disasters – earthquakes, floods & tornados • Blackouts and rolling brownouts due strain on public grid during peak demand • Onsite power generation and storage provides backup power to enable telecoms/businesses to function without interruption
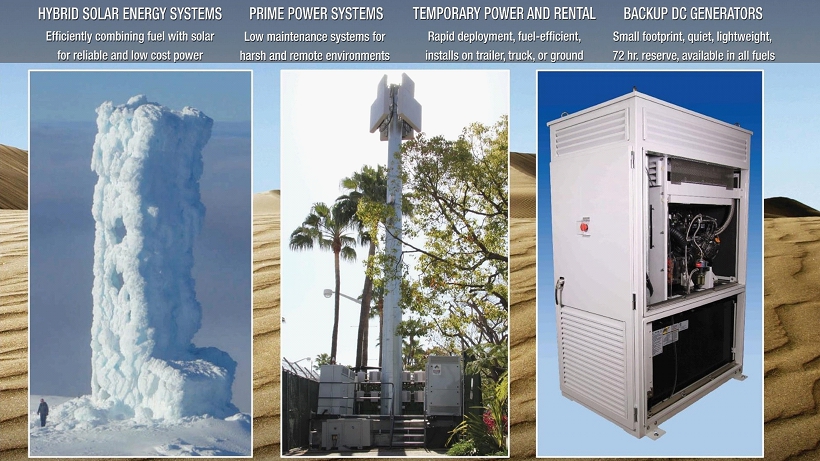
14
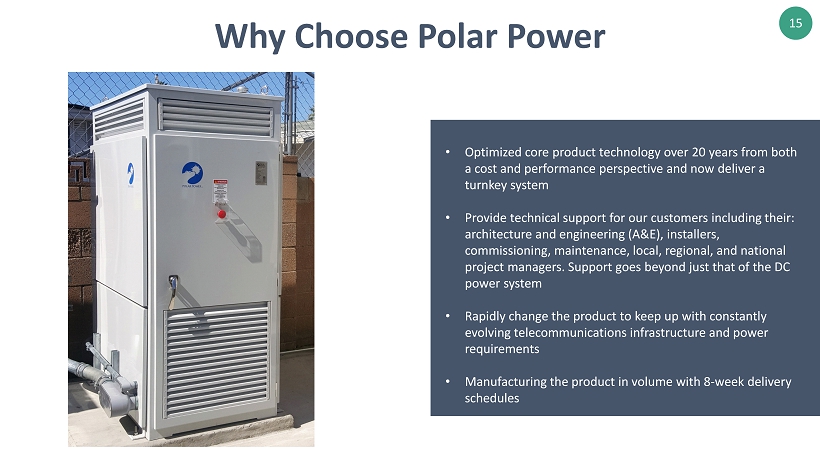
15 Why Choose Polar Power • Optimized core product technology over 20 years from both a cost and performance perspective and now deliver a turnkey system • Provide technical support for our customers including their: architecture and engineering (A&E), installers, commissioning, maintenance, local, regional, and national project managers. Support goes beyond just that of the DC power system • Rapidly change the product to keep up with constantly evolving telecommunications infrastructure and power requirements • Manufacturing the product in volume with 8 - week delivery schedules
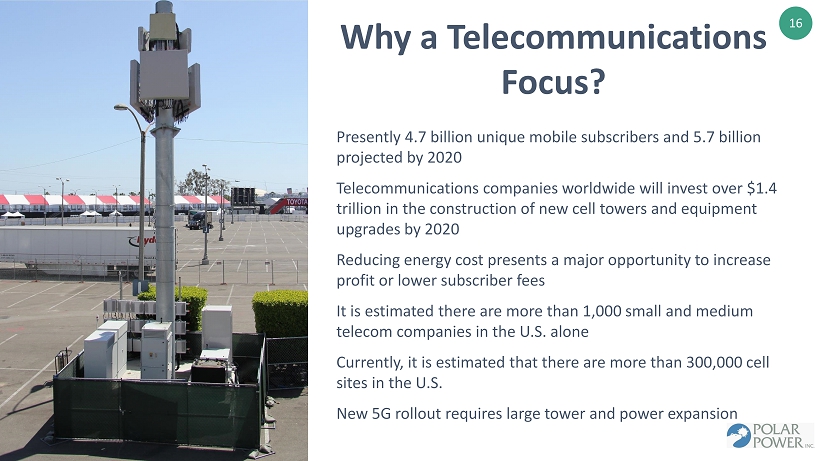
16 Why a Telecommunications Focus? Presently 4.7 billion unique mobile subscribers and 5.7 billion projected by 2020 Telecommunications companies worldwide will invest over $1.4 trillion in the construction of new cell towers and equipment upgrades by 2020 Reducing energy cost presents a major opportunity to increase profit or lower subscriber fees It is estimated there are more than 1,000 small and medium telecom companies in the U.S. alone Currently, it is estimated that there are more than 300,000 cell sites in the U.S. New 5G rollout requires large tower and power expansion
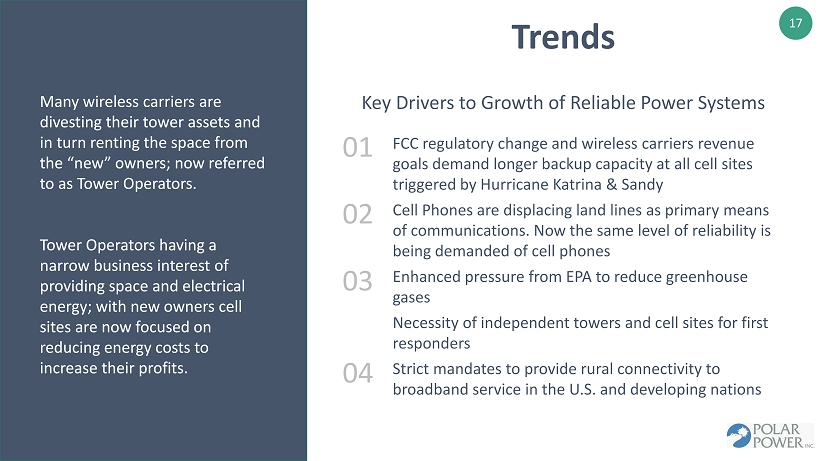
17 Trends FCC regulatory change and wireless carriers revenue goals demand longer backup capacity at all cell sites triggered by Hurricane Katrina & Sandy Cell Phones are displacing land lines as primary means of communications. Now the same level of reliability is being demanded of cell phones Enhanced pressure from EPA to reduce greenhouse gases Necessity of independent towers and cell sites for first responders Strict mandates to provide rural connectivity to broadband service in the U.S. and developing nations Many wireless carriers are divesting their tower assets and in turn renting the space from the “new” owners; now referred to as Tower Operators. Tower Operators having a narrow business interest of providing space and electrical energy; with new owners cell sites are now focused on reducing energy costs to increase their profits. Key Drivers to Growth of Reliable Power Systems 01 02 03 04
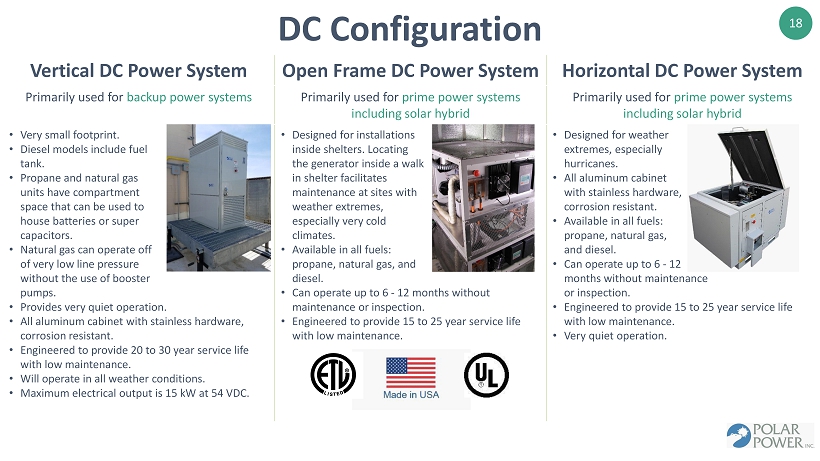
18 Vertical DC Power System Open Frame DC Power System Horizontal DC Power System Primarily used for backup power systems Primarily used for prime power systems including solar hybrid Primarily used for prime power systems including solar hybrid • Very small footprint. • Diesel models include fuel tank. • Propane and natural gas units have compartment space that can be used to house batteries or super capacitors. • Natural gas can operate off of very low line pressure without the use of booster pumps. • Provides very quiet operation. • All aluminum cabinet with stainless hardware, corrosion resistant. • Engineered to provide 20 to 30 year service life with low maintenance. • Will operate in all weather conditions. • Maximum electrical output is 15 kW at 54 VDC. • Designed for installations inside shelters. Locating the generator inside a walk in shelter facilitates maintenance at sites with weather extremes, especially very cold climates. • Available in all fuels: propane, natural gas, and diesel. • Can operate up to 6 - 12 months without maintenance or inspection. • Engineered to provide 15 to 25 year service life with low maintenance. • Designed for weather extremes, especially hurricanes. • All aluminum cabinet with stainless hardware, corrosion resistant. • Available in all fuels: propane, natural gas, and diesel. • Can operate up to 6 - 12 months without maintenance or inspection. • Engineered to provide 15 to 25 year service life with low maintenance. • Very quiet operation. DC Configuration
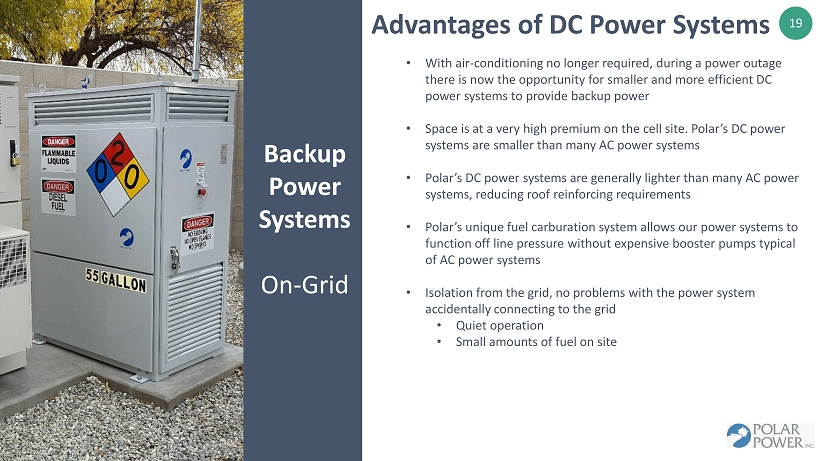
19 Backup Power Systems On - Grid Advantages of DC Power Systems • With air - conditioning no longer required, during a power outage there is now the opportunity for smaller and more efficient DC power systems to provide backup power • Space is at a very high premium on the cell site. Polar’s DC power systems are smaller than many AC power systems • Polar’s DC power systems are generally lighter than many AC power systems, reducing roof reinforcing requirements • Polar’s unique fuel carburation system allows our power systems to function off line pressure without expensive booster pumps typical of AC power systems • Isolation from the grid, no problems with the power system accidentally connecting to the grid • Quiet operation • Small amounts of fuel on site
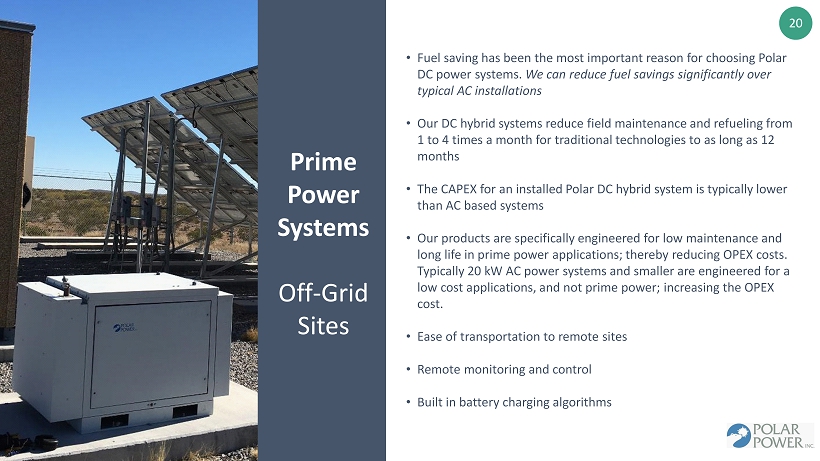
20 Prime Power Systems Off - Grid Sites • Fuel saving has been the most important reason for choosing Polar DC power systems. We can reduce fuel savings significantly over typical AC installations • Our DC hybrid systems reduce field maintenance and refueling from 1 to 4 times a month for traditional technologies to as long as 12 months • The CAPEX for an installed Polar DC hybrid system is typically lower than AC based systems • Our products are specifically engineered for low maintenance and long life in prime power applications; thereby reducing OPEX costs. Typically 20 kW AC power systems and smaller are engineered for a low cost applications, and not prime power; increasing the OPEX cost. • Ease of transportation to remote sites • Remote monitoring and control • Built in battery charging algorithms
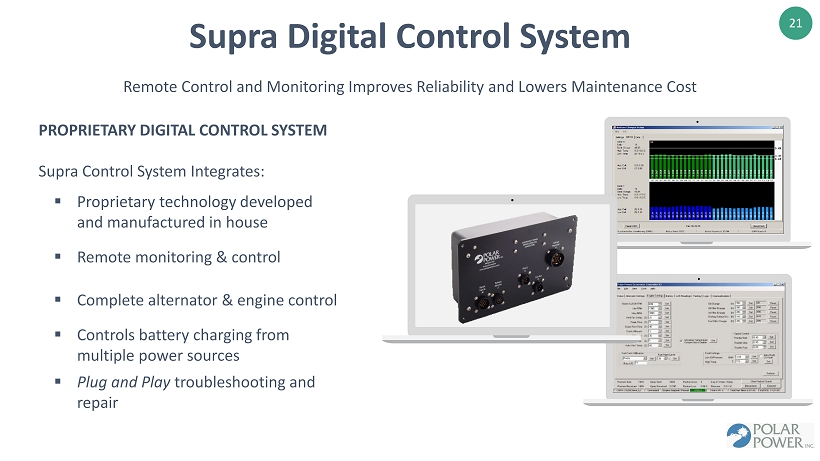
21 Supra Digital Control System Remote Control and Monitoring Improves Reliability and Lowers Maintenance Cost PROPRIETARY DIGITAL CONTROL SYSTEM Supra Control System Integrates: ▪ Proprietary technology developed and manufactured in house ▪ Remote monitoring & control ▪ Complete alternator & engine control ▪ Controls battery charging from multiple power sources ▪ Plug and Play troubleshooting and repair
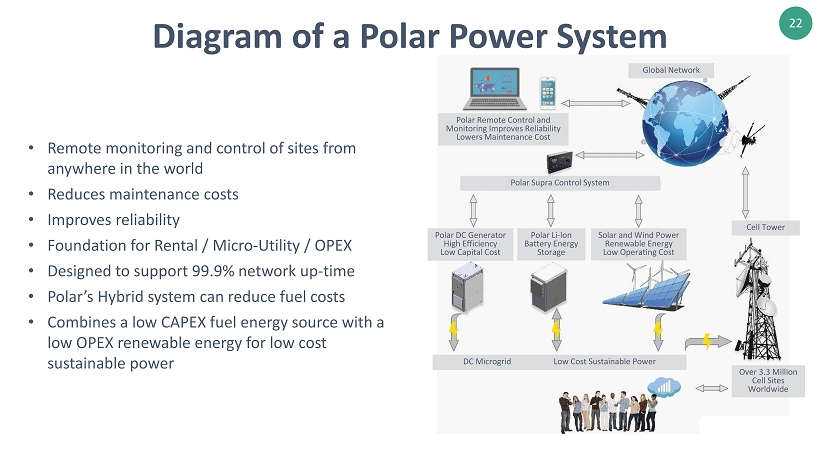
22 • Remote monitoring and control of sites from anywhere in the world • Reduces maintenance costs • Improves reliability • Foundation for Rental / Micro - Utility / OPEX • Designed to support 99.9% network up - time • Polar’s Hybrid system can reduce fuel costs • Combines a low CAPEX fuel energy source with a low OPEX renewable energy for low cost sustainable power Polar Remote Control and Monitoring Improves Reliability Lowers Maintenance Cost Global Network Polar Supra Control System Polar DC Generator High Efficiency Low Capital Cost Polar Li - Ion Battery Energy Storage Solar and Wind Power Renewable Energy Low Operating Cost Cell Tower DC Microgrid Low Cost Sustainable Power Over 3.3 Million Cell Sites Worldwide Diagram of a Polar Power System
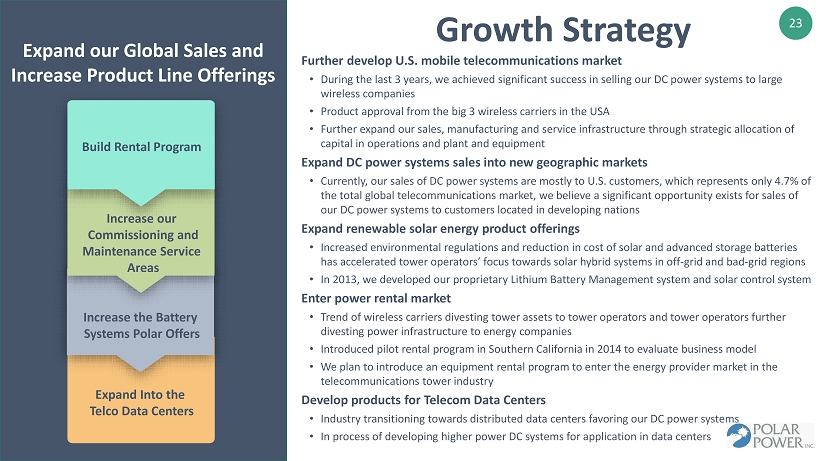
23 Growth Strategy Further develop U.S. mobile telecommunications market • During the last 3 years, we achieved significant success in selling our DC power systems to large wireless companies • Product approval from the big 3 wireless carriers in the USA • Further expand our sales, manufacturing and service infrastructure through strategic allocation of capital in operations and plant and equipment Expand DC power systems sales into new geographic markets • Currently, our sales of DC power systems are mostly to U.S. customers, which represents only 4.7% of the total global telecommunications market, we believe a significant opportunity exists for sales of our DC power systems to customers located in developing nations Expand renewable solar energy product offerings • Increased environmental regulations and reduction in cost of solar and advanced storage batteries has accelerated tower operators’ focus towards solar hybrid systems in off - grid and bad - grid regions • In 2013, we developed our proprietary Lithium Battery Management system and solar control system Enter power rental market • Trend of wireless carriers divesting tower assets to tower operators and tower operators further divesting power infrastructure to energy companies • Introduced pilot rental program in Southern California in 2014 to evaluate business model • We plan to introduce an equipment rental program to enter the energy provider market in the telecommunications tower industry Develop products for Telecom Data Centers • Industry transitioning towards distributed data centers favoring our DC power systems • In process of developing higher power DC systems for application in data centers Expand our Global Sales and Increase Product Line Offerings Build Rental Program Increase our Commissioning and Maintenance Service Areas Increase the Battery Systems Polar Offers Expand Into the Telco Data Centers
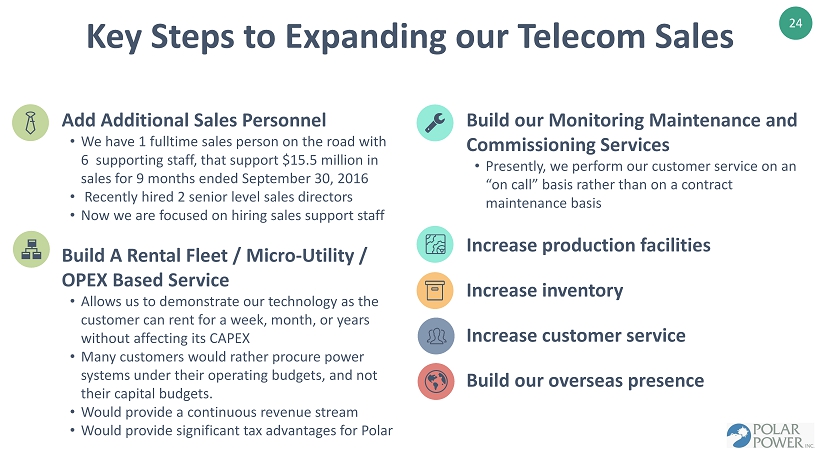
24 Key Steps to Expanding our Telecom Sales Add Additional Sales Personnel • We have 1 fulltime sales person on the road with 6 supporting staff, that support $15.5 million in sales for 9 months ended September 30, 2016 • Recently hired 2 senior level sales directors • Now we are focused on hiring sales support staff Build A Rental Fleet / Micro - Utility / OPEX Based Service • Allows us to demonstrate our technology as the customer can rent for a week, month, or years without affecting its CAPEX • Many customers would rather procure power systems under their operating budgets, and not their capital budgets. • Would provide a continuous revenue stream • Would provide significant tax advantages for Polar Build our Monitoring Maintenance and Commissioning Services • Presently, we perform our customer service on an “on call” basis rather than on a contract maintenance basis Increase production facilities Increase inventory Increase customer service Build our overseas presence
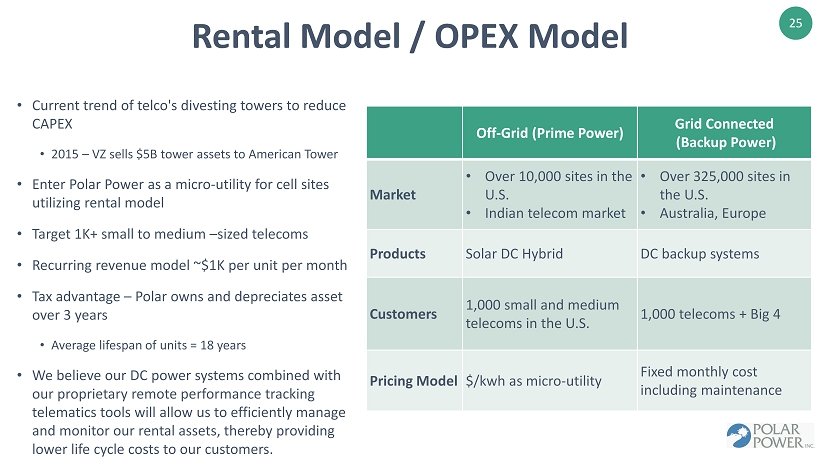
25 Rental Model / OPEX Model Off - Grid (Prime Power) Grid Connected (Backup Power) Market • Over 10,000 sites in the U.S. • Indian telecom market • Over 325,000 sites in the U.S. • Australia, Europe Products Solar DC Hybrid DC backup systems Customers 1,000 small and medium telecoms in the U.S. 1,000 telecoms + Big 4 Pricing Model $/kwh as micro - utility Fixed monthly cost including maintenance • Current trend of telco's divesting towers to reduce CAPEX • 2015 – VZ sells $5B tower assets to American Tower • Enter Polar Power as a micro - utility for cell sites utilizing rental model • Target 1K+ small to medium – sized telecoms • Recurring revenue model ~$1K per unit per month • Tax advantage – Polar owns and depreciates asset over 3 years • Average lifespan of units = 18 years • We believe our DC power systems combined with our proprietary remote performance tracking telematics tools will allow us to efficiently manage and monitor our rental assets, thereby providing lower life cycle costs to our customers.
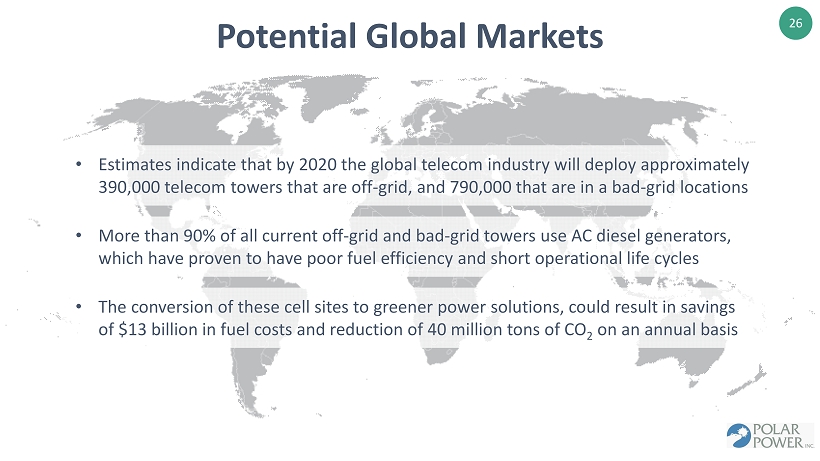
26 Potential Global Markets • Estimates indicate that by 2020 the global telecom industry will deploy approximately 390,000 telecom towers that are off - grid, and 790,000 that are in a bad - grid locations • More than 90% of all current off - grid and bad - grid towers use AC diesel generators, which have proven to have poor fuel efficiency and short operational life cycles • The conversion of these cell sites to greener power solutions, could result in savings of $13 billion in fuel costs and reduction of 40 million tons of CO 2 on an annual basis
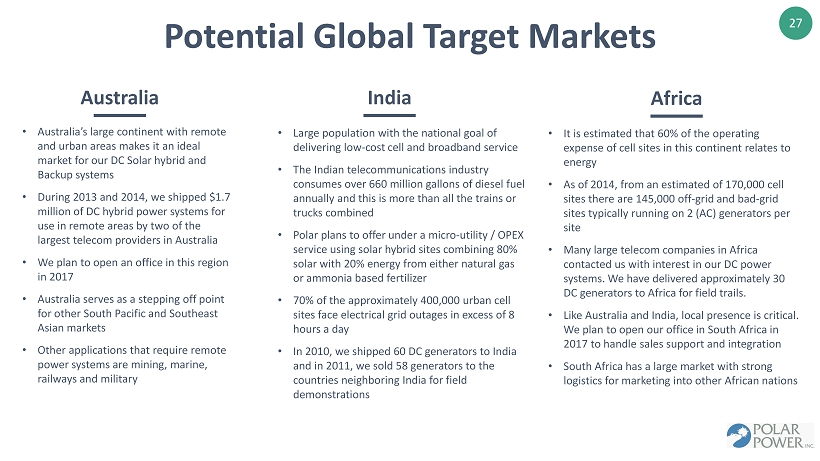
27 Potential Global Target Markets Australia • Australia’s large continent with remote and urban areas makes it an ideal market for our DC Solar hybrid and Backup systems • During 2013 and 2014, we shipped $1.7 million of DC hybrid power systems for use in remote areas by two of the largest telecom providers in Australia • We plan to open an office in this region in 2017 • Australia serves as a stepping off point for other South Pacific and Southeast Asian markets • Other applications that require remote power systems are mining, marine, railways and military • Large population with the national goal of delivering low - cost cell and broadband service • The Indian telecommunications industry consumes over 660 million gallons of diesel fuel annually and this is more than all the trains or trucks combined • Polar plans to offer under a micro - utility / OPEX service using solar hybrid sites combining 80% solar with 20% energy from either natural gas or ammonia based fertilizer • 70% of the approximately 400,000 urban cell sites face electrical grid outages in excess of 8 hours a day • In 2010, we shipped 60 DC generators to India and in 2011, we sold 58 generators to the countries neighboring India for field demonstrations • It is estimated that 60% of the operating expense of cell sites in this continent relates to energy • As of 2014, from an estimated of 170,000 cell sites there are 145,000 off - grid and bad - grid sites typically running on 2 (AC) generators per site • Many large telecom companies in Africa contacted us with interest in our DC power systems. We have delivered approximately 30 DC generators to Africa for field trails. • Like Australia and India, local presence is critical. We plan to open our office in South Africa in 2017 to handle sales support and integration • South Africa has a large market with strong logistics for marketing into other African nations India Africa
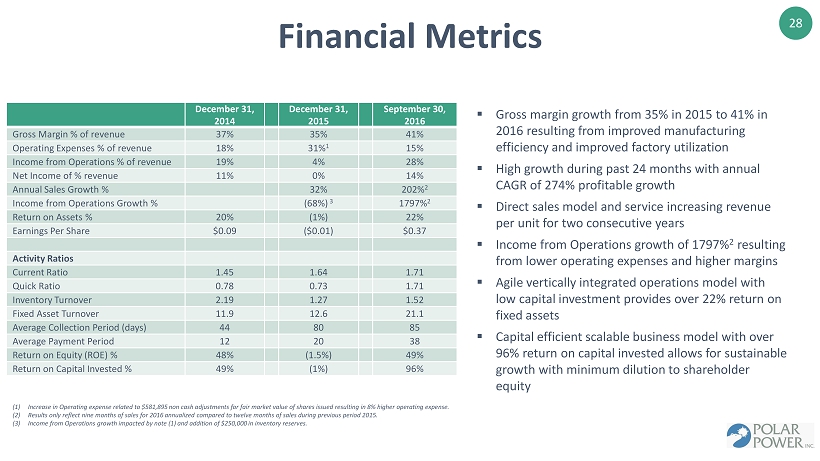
28 ▪ Gross margin growth from 35% in 2015 to 41% in 2016 resulting from improved manufacturing efficiency and improved factory utilization ▪ High growth during past 24 months with annual CAGR of 274% profitable growth ▪ Direct sales model and service increasing revenue per unit for two consecutive years ▪ Income from Operations growth of 1797% 2 resulting from lower operating expenses and higher margins ▪ Agile vertically integrated operations model with low capital investment provides over 22% return on fixed assets ▪ Capital efficient scalable business model with over 96% return on capital invested allows for sustainable growth with minimum dilution to shareholder equity (1) Increase in Operating expense related to $581,895 non cash adjustments for fair market value of shares issued resulting in 8% hi gher operating expense. (2) Results only reflect nine months of sales for 2016 annualized compared to twelve months of sales during previous period 2015. (3) Income from Operations growth impacted by note (1) and addition of $250,000 in inventory reserves. Financial Metrics December 31 , 2014 December 31, 2015 September 30, 2016 Gross Margin % of revenue 37% 35% 41% Operating Expenses % of revenue 18% 31% 1 15% Income from Operations % of revenue 19% 4% 28% Net Income of % revenue 11% 0% 14% Annual Sales Growth % 32% 202% 2 Income from Operations Growth % (68%) 3 1797% 2 Return on Assets % 20% (1%) 22% Earnings Per Share $ 0.09 ($0.01) $ 0.37 Activity Ratios Current Ratio 1.45 1.64 1.71 Quick Ratio 0.78 0.73 1.71 Inventory Turnover 2.19 1.27 1.52 Fixed Asset Turnover 11.9 12.6 21.1 Average Collection Period (days) 44 80 85 Average Payment Period 12 20 38 Return on Equity (ROE) % 48% (1.5%) 49% Return on Capital Invested % 49% (1%) 96%
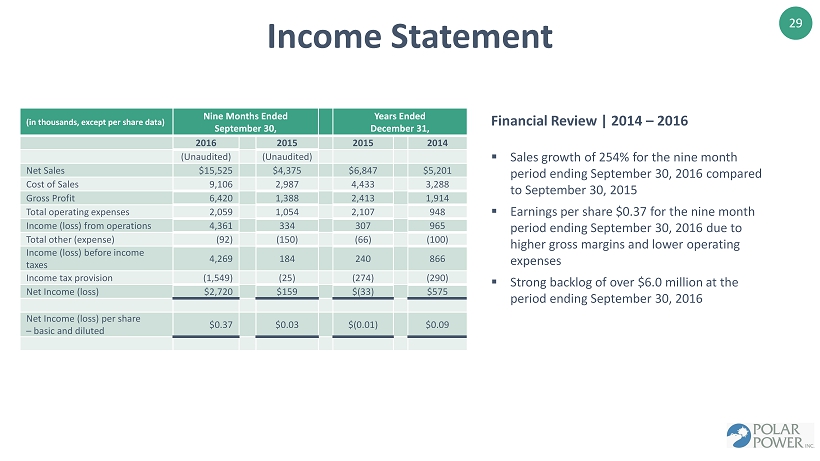
29 Financial Review | 2014 – 2016 ▪ Sales growth of 254% for the nine month period ending September 30, 2016 compared to September 30, 2015 ▪ Earnings per share $0.37 for the nine month period ending September 30, 2016 due to higher gross margins and lower operating expenses ▪ Strong backlog of over $6.0 million at the period ending September 30, 2016 Income Statement (in thousands, except per share data) Nine Months Ended September 30, Years Ended December 31, 2016 2015 2015 2014 (Unaudited) (Unaudited) Net Sales $15,525 $4,375 $6,847 $5,201 Cost of Sales 9,106 2,987 4,433 3,288 Gross Profit 6,420 1,388 2,413 1,914 Total operating expenses 2,059 1,054 2,107 948 Income (loss) from operations 4,361 334 307 965 Total other (expense) (92) (150) (66) (100) Income (loss) before income taxes 4,269 184 240 866 Income tax provision (1,549) (25) (274) (290) Net Income (loss) $2,720 $159 $(33) $575 Net Income (loss ) per share – basic and diluted $0.37 $0.03 $(0.01) $0.09
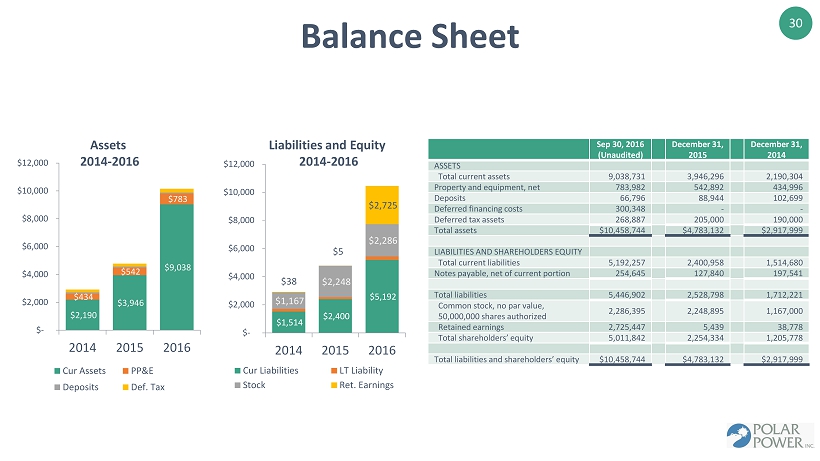
30 Balance Sheet $2,190 $3,946 $9,038 $434 $542 $783 $- $2,000 $4,000 $6,000 $8,000 $10,000 $12,000 2014 2015 2016 Cur Assets PP&E Deposits Def. Tax $1,514 $2,400 $5,192 $1,167 $2,248 $2,286 $38 $5 $2,725 $- $2,000 $4,000 $6,000 $8,000 $10,000 $12,000 2014 2015 2016 Cur Liabilities LT Liability Stock Ret. Earnings Assets 2014 - 2016 Liabilities and Equity 2014 - 2016 Sep 30, 2016 (Unaudited) December 31, 2015 December 31 , 2014 ASSETS Total current assets 9,038,731 3,946,296 2,190,304 Property and equipment, net 783,982 542,892 434,996 Deposits 66,796 88,944 102,699 Deferred financing costs 300,348 - - Deferred tax assets 268,887 205,000 190,000 Total assets $10,458,744 $4,783,132 $2,917,999 LIABILITIES AND SHAREHOLDERS EQUITY Total current liabilities 5,192,257 2,400,958 1,514,680 Notes payable, net of current portion 254,645 127,840 197,541 Total liabilities 5,446,902 2,528,798 1,712,221 Common stock, no par value, 50,000,000 shares authorized 2,286,395 2,248,895 1,167,000 Retained earnings 2,725,447 5,439 38,778 Total shareholders’ equity 5,011,842 2,254,334 1,205,778 Total liabilities and shareholders’ equity $10,458,744 $4,783,132 $2,917,999

31 Pre - IPO Capitalization Table Class Number Percentage Common Shares - Directors and Executive Officers* 6,197,476 84% Common Shares - Others 1,185,682 16% Warrants 0 0% Options 0 0% Total 7,383,158 100% ▪ $55.4 million pre - offering valuation, at the midpoint of the expected offering range * 5,578,176 shares held by Arthur D. Sams
32 ▪ History of innovation and investments in new products and proprietary technologies. ▪ 88% of current sales driven by new products launched since 2006 ▪ Robust product pipeline focusing on renewable energy solutions for off - grid applications ▪ Moved to Gardena (14 miles from LAX) in early 2015, to expand manufacturing capacity ▪ Effective cost management providing strong gross margins of 41% in nine months ending September 30, 2016 ▪ Vertically integrated operations with global sourcing of key components. ▪ Over 100 full time employees ▪ High growth during past 24 months with annual profitable growth of 274% ▪ 30 Years of brand recognition and reputation in DC power and cooling solutions ▪ Successful direct sales and service model for U.S. markets ▪ Intend to build a recurring revenue rental program for the telecom market leveraging our service infrastructure ▪ 255% Net Sales growth for the nine months ending September 30, 2016 compared to the nine months ending September 30, 2015 ▪ Funded a decade of growth with free cash flow generated by operations ▪ Raised $1.7 million in equity during 2014 and 2015 to fund growth ▪ Decades of management experience in managing growth and diverse market opportunities Operations Finance Sales and Service R&D , Technologies and Products Highlights
33 Contact Us investor@polarpower.com +1 310 830 9153 www.polarpower.com 249 E. Gardena Blvd. Gardena, CA